How to read the chart, with pictures
Real screenshots from a Bitcoin 5-minute round, with every part of the chart numbered and explained. Then how the bots use it, and the questions to ask yourself before you'd ever bet on a round.
Updated 2026-11-03
1. The top of the page
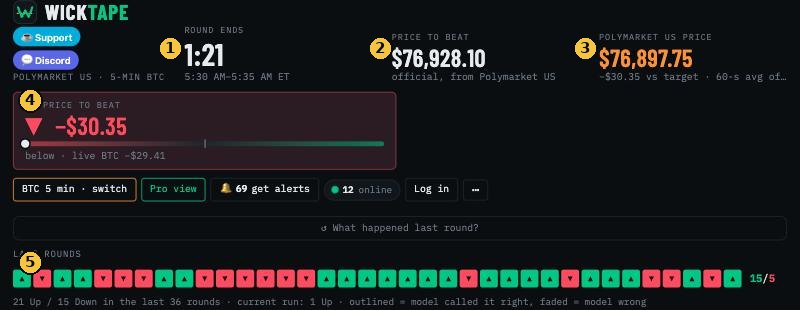
- Round ends: the countdown. Every round is a fresh Up-or-Down question.
- Price to beat: the official starting price of this round. If the end price is at or above it, Up wins. Below it, Down wins.
- Polymarket US price: the price that settles the round. For crypto it's a 60-second average (BRTI), so it moves slower than the coin itself.
- Vs price to beat: how far above (green ▲) or below (red ▼) the price to beat we are right now. The dot on the bar shows the same thing.
- Last rounds: how the previous rounds ended, oldest on the left. Outlined boxes are rounds the model called right.
2. The live chart
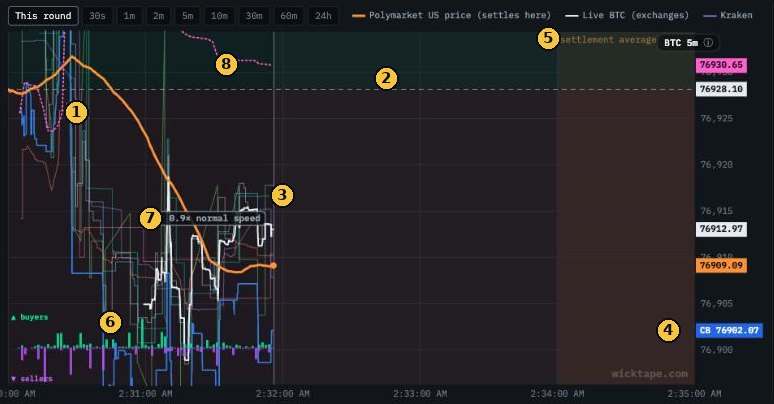
- Orange line, the settlement price. This is the line that decides the round. It's an average, so it bends smoothly and lags the coin a little.
- Dashed line, the price to beat. Orange above it at the end means Up; below means Down.
- White line, the live price from the big exchanges. It moves first. The orange average follows where the white line goes.
- Blue line and the CB tag, Coinbase. One exchange on its own, updated the moment a trade happens.
- Settlement average zone (the shaded strip on the right): the last 60 seconds. The final price is the average of this minute, so once you're inside it every second that passes gets locked in.
- Buyers and sellers along the bottom: green bars are trades buying, purple bars are trades selling, on the big exchanges.
- Speed badge: how fast the market is moving compared with normal. 1× is a normal day; 3× is a wild one.
- Pink dotted line, VWAP: the average price traders have paid since the round started, weighted by size. The small RSI badge in the corner shows if the last few minutes were stretched up (70+) or down (30 or less).
3. Buyers vs sellers

The bar above the chart sums up the last 30 seconds of trading on the big exchanges, and the line under it shows the last 10 seconds. Lots of selling usually means the price is being pushed down right now. It doesn't tell you what happens next. By the time you see a wave, it's mostly already in the price.
4. The "where it ends up" line
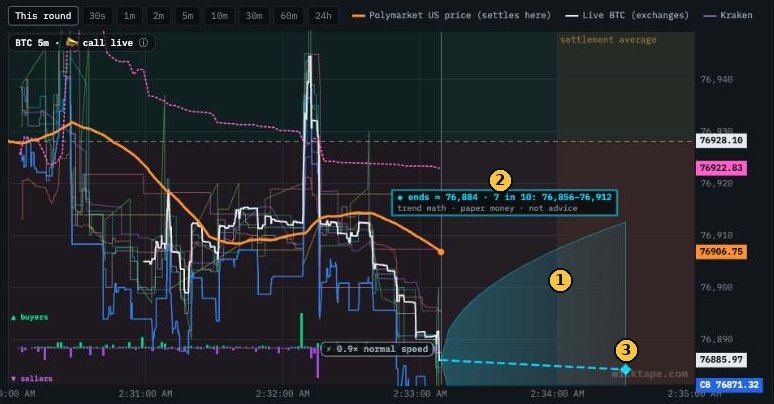
- The cone: about 7 times in 10, the end price lands inside it. It's wide when the market is jumpy and narrow when it's calm.
- The label: the middle guess and the 7-in-10 range in dollars.
- The ◆ diamond: the middle guess, placed in the settlement minute.
This is simple trend math, not a prediction from the bots. In our tests it picked the winning side about 78% of the time at 2:30 left, about the same as Polymarket's own price. So treat it as a picture of the odds, not an edge.
5. Zoom out: 60 minutes and 24 hours
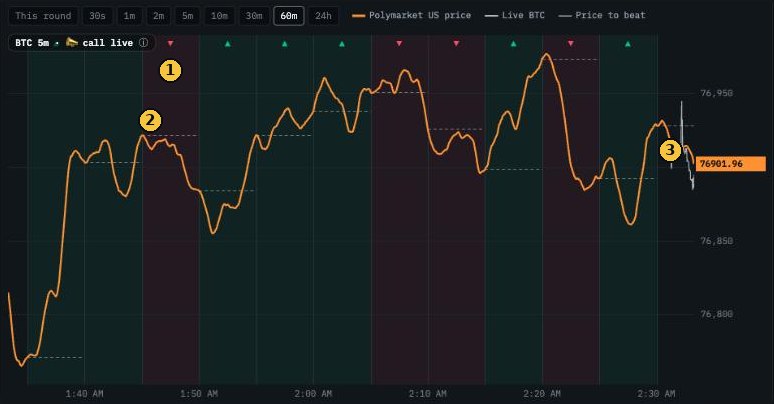
- ▲ / ▼ and the shading: how each round ended. Green ended Up, red ended Down.
- Short dashed lines: each round's price to beat.
- The live end of the line, where the current round is.
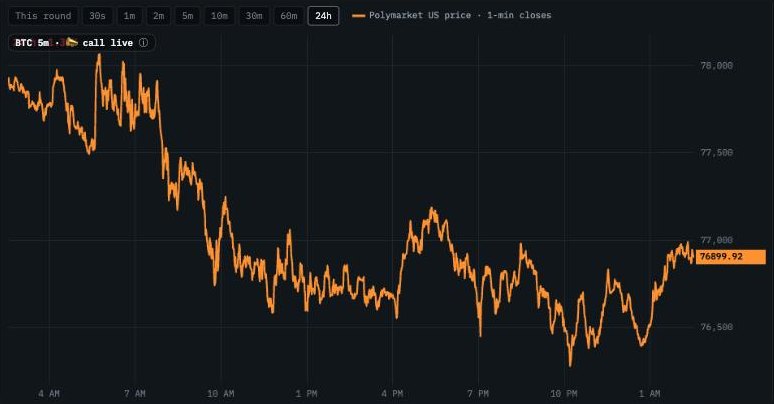
Zooming out shows the bigger picture: was the coin falling all day, or chopping sideways? Our research found that over minutes to days, prices tend to snap back after a big stretch more often than they keep running. That's a tendency, not a rule.
6. How the bots use the chart
Every second, each market's bot does the same three things:
- Estimates the chance Up wins from what the chart shows: how far the price is from the price to beat, how much time is left, and how fast the market is moving.
- Compares it with Polymarket's price. A price of 70¢ means the market thinks there's a 70% chance. The bot buys only when its own chance is clearly higher than the price, after fees.
- Manages the bet: it sells early only when selling is worth more than holding. Otherwise it holds to the result, and it sits out rounds that look like a coin flip.
Its buys show up on the chart as ▲ (bought Up) and ▼ (bought Down), with ✓ or ✗ at the end of the round. Everything is paper money. More in How WickTape's bots decide.
7. Using the chart to think about a round
This isn't a strategy and it isn't advice. These are the questions the chart helps you answer, the same ones the bots ask:
- Gap vs time. $30 below with 4 minutes left is close to a coin flip. $30 below with 20 seconds left, inside the settlement minute, is nearly decided. Always read the gap together with the clock.
- Where is the white line going? The orange average follows the live price. If the white line has already crossed the dashed line, the orange line usually follows.
- Is the price already right? If Up costs 85¢, the market already thinks Up is very likely. You only come out ahead over time if you're right more often than the price you pay. At 95¢ a win pays 5¢ and a loss costs 95¢.
- Don't chase spikes. A sudden jump with heavy buying is usually priced in by the time you see it. When we tested betting against jumps, it still lost.
- Early in the round is the hardest. With 4–5 minutes left, almost anything can happen; our bots' early bets did worse than their late ones.
- Fees count. Polymarket US charges a fee on each trade (see fees), so small edges disappear.
- Practice first. Watch the bots trade paper money, and check the track record to see how often they're really right compared with the price they paid.
Quick answers
What is the orange line on the WickTape chart?
The Polymarket US settlement price: for crypto, the 60-second BRTI average that decides whether Up or Down wins.
What is the dashed line?
The price to beat, the official starting price of the round. Up wins if the end price is at or above it.
What does the shaded cone mean?
From halfway through the round, it shows where the end price lands about 7 times in 10, based on simple trend math. It isn't advice.
Can I see more than one round?
Yes. Use the 10m, 30m, 60m and 24h buttons above the chart to zoom out.